- April 9, 2015
- Posted by:
- Category:BLOG, ExPress, Mumbai
By: Shreenivas Kunte
Time lines drive market activity and invariably play a critical role in determining outcomes. The rallies as well as the downturns that markets experience have an unseen stopwatch attached. It is not difficult to observe how the wheels of time unexpectedly alter the course that the markets chart – a wrong prediction in the short term turns out to be accurate in the longer term and vice versa. Participants use the words – long term and short term – to qualify actions. What then is the short term and what can be treated as long term? A quarter, a year, five years, a decade, a generation (period between birth of parents and birth of their offspring – about 30 years) are all time periods that mark specific commonly accepted milestones. In terms of market performance what do these time periods signify? Can expectations in the stock market change as longer time periods alter the return profile? A recent regional note has highlighted a blog that talks about these concepts in the context of US markets.
The blog reviews what many of us may be aware of. As time frames expand, the chance of a positive return becomes significant. Examining this through actual index returns however provides a context and helps set expectations.
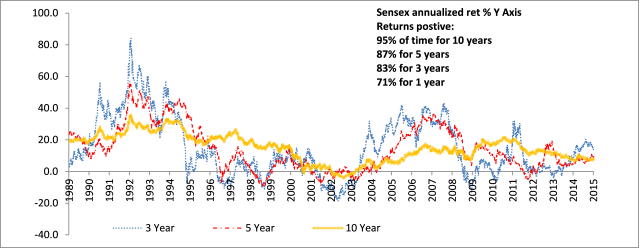
How do S&P 500 results compare with India? For the Sensex, as shown in the graph (Exhibit 1), the chance for a positive return increases from 71% for rolling 1 year returns to 95% for rolling 10 year returns (data sourced from Bloomberg). For 20 year and 30 year buy and hold rolling periods (not shown in the graph), historically (Sensex data from 1979), there have been zero instances of negative returns. The average annualized volatility (not shown in the graphs) reduces from 26% for yearly returns to below 10% for rolling return windows of 10 years and above. The second chart (Exhibit 2) shows a comparison of 5 year and 10 year rolling return windows for regional stock market indexes and the S&P. Over a 10 year rolling return period the Hang Seng index (HSI) has the best chance of a positive return (97%). In comparison, Japan’s Nikkei has the lowest (56%) chance of a positive return outcome over a 10 year rolling window period.
Exhibit 1 – Annualized Sensex Rolling Returns over different periods (Data source: Bloomberg)
Exhibit 2 – Average Annualized Returns over different periods across indexes (Data source: Bloomberg)
Past trends are never a guarantee for the future. The time periods for a higher certainty in positive returns could change from 10 years to another number. But an understanding that time frames beyond 5 years decrease the chance of negative market moves can help in our endeavours to be vaguely right than to be precisely wrong (Keynes).
– SK


