- January 26, 2021
- Posted by: CFA Society India
- Category:ExPress

Written by
Prashant Shah, CFA, CIPM
We all invest in the Equity Markets in order to generate wealth through (hopefully outsized) returns on our capital deployed; expectations are that the returns would be higher than investing in alternative asset classes/avenues. One of the avenues to invest in Equity Markets, that is fast gaining traction and favour with investors, is the Exchange Traded Fund (ETF). For the uninitiated, ETFs replicate the holdings of the underlying benchmark index in exactly the same proportion as the index in an effort to match the returns of the index over various time periods. Because there is no attempt to outperform the index through variation in holdings in the ETF v/s the index, these are passively managed funds.
Why is investing in an ETF catching on with investors and advisers? It gives the investor a returns profile similar to the benchmark (exactly matching returns are impossible, considering the lags involved in replicating the changes in the benchmarks, deploying the dividends received from index stocks, impossibility of exactly matching the stock weightings of the index), is low cost (with fund expenses in range of 0.1% to 0.5% p.a.), liquid and transparent with quotes available in real time (unlike for a MF, when NAV is available only at the end of the day, after the market has closed).
However, investing in an ETF is not straight forward or simple. There are multiple indices available which are tracked by ETFs and in which an investor can invest. Given below is a list of Indian equity indices which are replicated by various MF ETFs:

There are similar indices available for debt instruments, for CPSE’s/public sector/government owned companies also, but I have currently restricted my focus on diversified equity indices for purposes of this analysis; but the overall rationale, investment rationale and short-listing of ETFs to invest in should remain the same in case of these ETFs also.
Out of the above, which index and finally which ETF should one invest in?
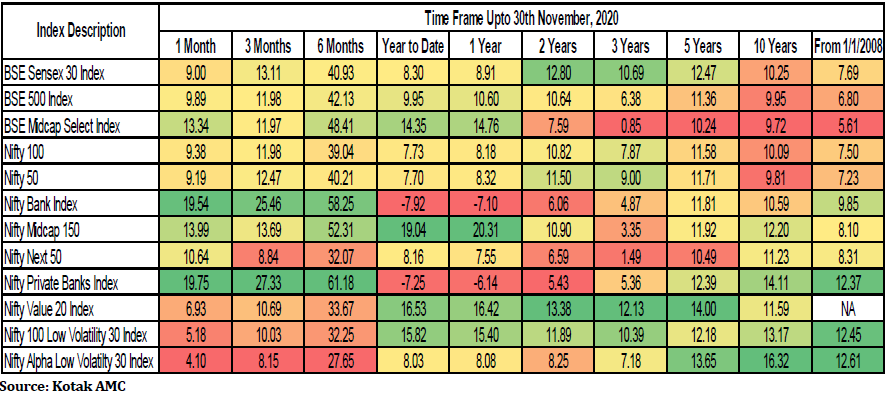
The first step is in determining the investment horizon and then evaluating the returns performance of the various indices over that horizon as also shorter & longer horizons. The below table shows returns performance for different indices over various horizons:

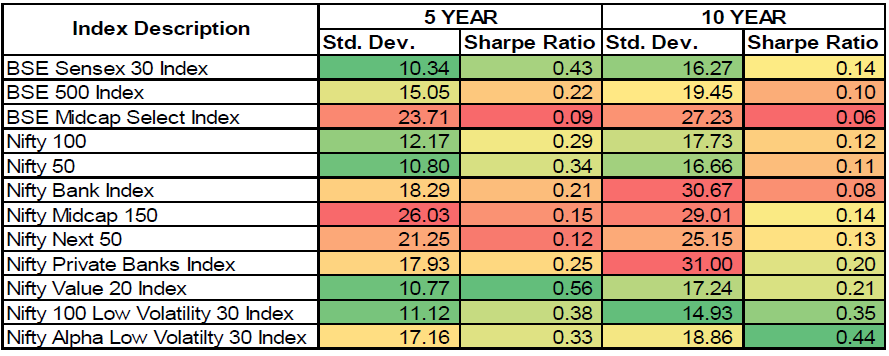
After defining the investment horizon and the returns generated over this horizon, an additional analysis of risk-adjusted returns would also be helpful in identifying the index to invest in. For e.g., I have analysed risk-adjusted returns below by computing the standard deviation of returns of the different indices for 5 & 10 years horizons (my preferred holding periods) which is used to then compute the Sharpe Ratio for the indices.

For instance, based on my preferred investing horizon of 5 years, and returns performance of the various indices over this period, I selected the following 3 indices as potential targets for ETF investing:
1). Nifty Value 20 Index;
2). Nifty 100 Low Volatility 30 Index; and
3). Nifty Alpha Low Volatility 30 Index.
In case of multiple target indices (as in my case above), it would be advisable to analyse their constituent holdings in order to avoid duplication of the portfolio by investing in different index strategies with similar holdings.
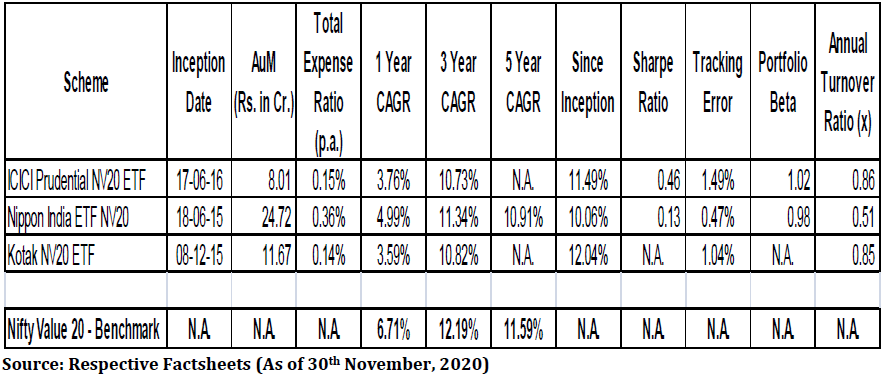
Next comes the stage of identifying the actual ETFs through which to invest in the target index. The decision of which ETF to invest in is a no-brainer when there is only 1 fund house tracking an index. However, in case there are multiple funds providing ETFs tracking the same index, the selection is not straight forward or as easy as selecting the one with the best returns performance. For e.g. given below are 3 ETFs tracking the Nifty Value 20 Index:

All of the 3 were launched in broadly similar time frames, but each has shown different performance across different time periods, since inception and against the benchmark. So how should one select from the alternatives available?
One should look at the following factors:
i). Tracking Error of ETF vis-a-vis the benchmark;
ii). The Total Expense Ratio;
iii). The Annual Turnover Ratio;
iv). The Sharpe Ratio; and
v). Asset under Management.
Ideally, look for a fund with the lowest of the first 3 and highest of the last 2. But it will not be that simple. Looking at the above table, ICICI Pru NV20 ETF has the highest Sharpe Ratio, lowest Total Expense Ratio and 2nd highest Since Inception Returns. But its Tracking Error and Annual Turnover Ratio are extraordinarily high while the AuM is the lowest among the 3 funds.
So there will be some trade-offs when evaluating the above factors to select one ETF to invest in. For instance, I have ultimately chosen the Nippon India ETF NV20 to invest in based on its lowest tracking error, larger AuM, lower Annual Turnover Ratio and comparatively closer benchmark return hugging performance of the fund over various time frames for which data is available despite the higher Total Expense Ratio and very low Sharpe Ratio. And the (marginally) longer track record also helped in the final analysis.
For complete analysis please click here
Disclaimer: “Any views or opinions represented in this blog are personal and belong solely to the author and do not represent views of CFA Society India or those of people, institutions or organizations that the owner may or may not be associated with in professional or personal capacity, unless explicitly stated.”
